Process Mining - Settings and exporting
Last updated About 2 months ago
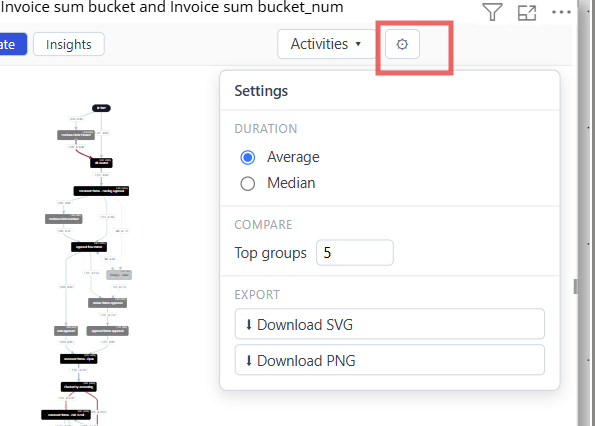
Click ⚙ Settings to access:
Duration: choose whether times shown throughout the visual (arrow labels, Insights) use the Average or Median of all observed durations. Median is less skewed by a few extremely slow outlier cases.
Compare: set how many attribute groups to display at once in Compare mode.
Export: download the current diagram view as an SVG (best for further editing, e.g. in PowerPoint) or PNG (best for pasting into documents or emails, exported at 2x resolution for print quality). Note that exports capture only the flowchart itself, not the toolbar, filter chips, or side panels.
Was this helpful?
Still need help? Ask the team